


PICTURE
Image description and file download
PLACEHOLDER
OffTransparency and understanding of project performance is increasing
Projects reporting High or Medium-High delivery confidence
More than half of the Tier 1 and 2 projects are on track
Projects reporting Medium-High or High delivery confidence
| Total projects (Tier 1 and 2) | 62 |
| Number with High or Medium-High delivery confidence (see table note) | 38 |
| Percentage with High or Medium-High delivery confidence | 61.3% |
| Total budget with High or Medium-High delivery confidence | $7.3 billion |
Table note: High or Medium-High delivery confidence indicates projects are on track to deliver agreed outcomes.
Preparing senior leaders to lead digital projects successfully
Senior Responsible Officials (SROs) for digital projects ensure timely and budget‑compliant delivery of benefits to Australians. To support these officials, a mandatory program is commencing early this year to ensure they are equipped to confidently lead digital projects successfully. This program includes a simulation of a digital project across its life with a focus on building capability in assurance, benefits management, governance, project remediation, and commercial acumen. Following final trials, the program will be available through the Australian Public Service Academy and mandated for all leaders of the major digital projects included in this report.
High demand for experienced staff
The successful delivery of digital projects relies heavily on the ability of the Australian Public Service (APS) to attract and retain specialist skills. However, in the 2023–24 State of the Service Report, over 80% of agencies indicated a critical skill shortage in digital and ICT skills.
Recognising the crucial role of technology vendors in delivering the Australian Government’s ambitions for digital transformation, the Digital and ICT Investment Oversight Framework includes ‘sourcing’ as an area of focus. As part of this, the DTA coordinates marketplaces and agreements designed to enable agencies to easily access technology goods and services to support their digital projects. In 2023-24, the Australian Government sourced more than $6.35b of digital products and services from industry via these marketplaces and agreements. By accessing these arrangements through the BuyICT platform, agencies benefited from the Australian Government's collective buying power and strengthened terms and conditions.
The DTA's latest ICT labour hire and professional services panel, the Digital Marketplace Panel 2, adopts the APS Career Pathfinder dataset and Skills Framework for the Information Age (SFIA) to classify ICT labour hire opportunities. The classification of roles and greater panel pricing transparency provides clearer signals for in-demand skills, their costs and potential shortages that will inform delivery capacity and confidence in digital projects. The top in-demand digital and ICT skills sourced by the APS include software engineer, solution architect and business analyst.
Image description
Placeholder
OffMost (75.9%) of the 29 Tier 1 and 2 projects entering oversight since February 2024 report a High or Medium-High delivery confidence. These projects commonly report factors contributing to their delivery confidence rating at the start as: establishing effective governance early; having well-prepared documentation and artefacts; and ensuring experienced and capable personnel were ready.
There are early signs that investment to strengthen digital project design processes is increasing overall delivery confidence.
Image description
PLACEHOLDER
OffSome continuing projects are reporting delivery difficulties
Of the 16 continuing projects that reported delivery confidences in February 2024, 11 projects either maintained or dropped in delivery confidence to Medium or lower in February 2025. These projects are routinely managing 3 or more delivery challenges that affected their assessments. Common trends include: financial pressures; scope complexities; resourcing constraints; tight schedules; technical issues; and a need to improve project management maturity.
While the goal is to see DCAs improving over time, it is common for delivery issues to worsen before they improve, especially when complex technical issues are involved. Some projects reporting lower DCAs are depending on the successful delivery of other projects as a part of a wider reform program. While they have been closely monitoring delivery, setbacks in other projects can result in these projects being delayed, as key components they need to stay on track become unavailable when needed.
Realising a ‘finger on the pulse’ to enable timely support and course corrections
In July 2024, a the DTA began a Project Data Reporting Standard (PDRS) trial. The trial is testing a new approach to enable more seamless and timely central tracking of project performance across the Australian Government, using ‘natural systems’.
Using ‘natural systems’ means project data is collected from internal reporting projects are preparing for their governance boards, rather than requiring agencies to prepare specific reporting for central tracking purposes.
This approach is:
- improving the quality of reporting and advice the DTA can provide to stakeholders across the Australian Government – including by enabling data to be collected more frequently
- supporting decision-making by ensuring digital governance boards consistently have the minimum necessary information required to enable good decisions (a condition of the trial is that a minimum set of information must be provided to the board)
- improving the experience of agencies providing data to the DTA in our oversight role.
The trial is enabling more timely and effective central oversight of digital projects, helping ensure support can be provided where it needed most and at the earliest stage when the chance of charting a course back to green is greatest.
Downloadable resources
Investment by sector
This section explores the projects underway across the Australian Government through a ‘sector’ lens.
Number of projects and total budget by sector
Digital projects under the DTA’s assurance oversight are improving systems and services across 9 sectors. A common thread across all sectors is investment to improve agency systems to meet digital standards and enable them to provide simple, secure and seamless services to Australians.
Project numbers and budgets have increased in most sectors.
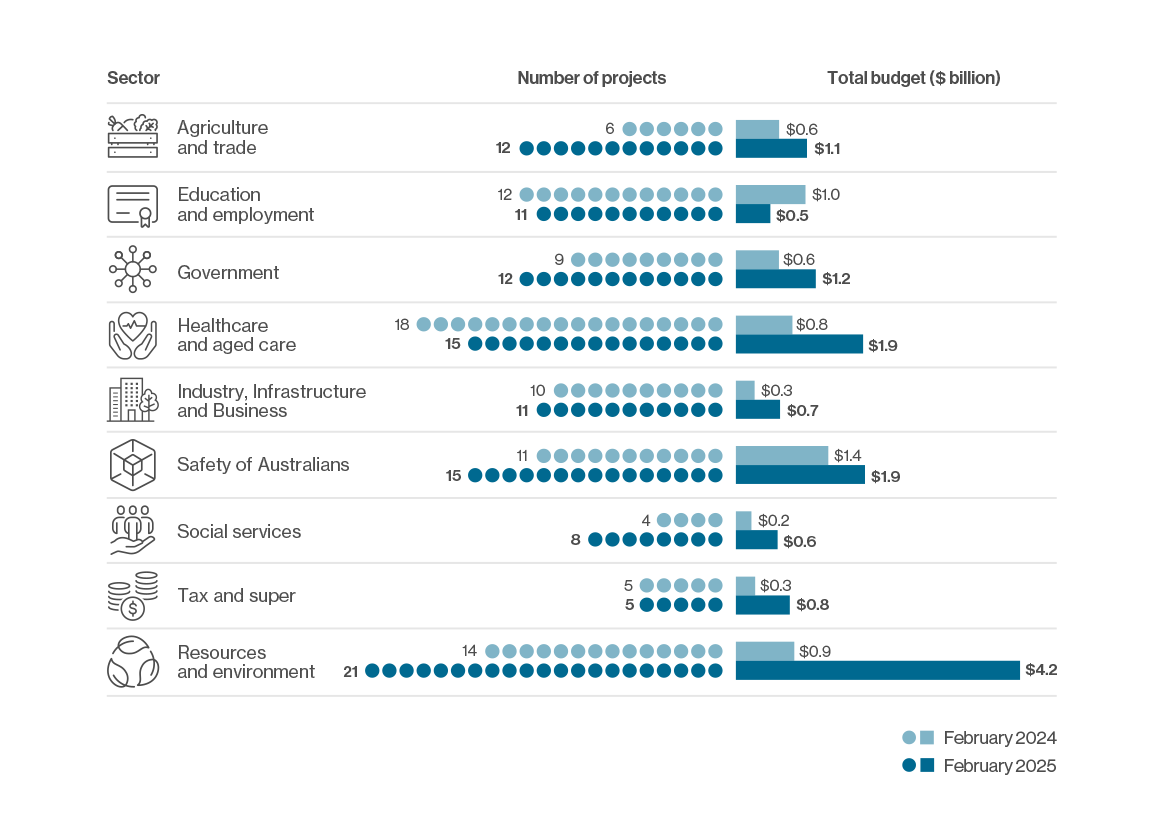
Image description
PLACEHOLDER
Off
Image description and download
PLACEHOLDER
OffDelivery confidence and duration of closed projects
Finishing up – how projects leaving the portfolio performed
Image description
PLACEHOLDER
OffOf the 13 Tier 1 and Tier 2 projects that closed, 10 (76.9%) reported a High or Medium-High delivery confidence. Just 2 projects had a rating of Medium or lower, while one project did not report a delivery confidence rating.
Between February 2024 and February 2025, and before closing, 4 of these projects improved their delivery confidence, and 3 projects stayed the same. Comparisons for the remaining projects are not possible as they did not report a delivery confidence in February 2024.
The average duration of closed projects was 2.5 years. Closed Tier 1 projects had a longer average duration than Tier 2 and Tier 3 projects. This longer average duration is mainly due to the inclusion of a closed 7-year Tier 1 project to improve weather and climate data.
Challenges and lessons learned
Projects that closed since February 2024 generally reported underspends. Those that went over budget reported issues including initial scoping not accounting for the full complexity of required work.
Some projects faced challenges in their ability to deliver against their original schedule due to delays getting bills introduced to Parliament, delays with equipment supply due to the COVID-19 pandemic, post-release issues that needed to be addressed, and additional enhancements that needed to be delivered to achieve expected outcomes.
Common lessons learned include:
- allocating sufficient time to early planning pre-implementation (preparation) stages, including ensuring a deep understanding of current state processes
- developing collaborative working relationships between stakeholders during scoping, delivery planning and decision-making – including efficient knowledge transfer and upskilling as needed
- defining project scope in as much detail as possible, to avoid confusion in deliverables and align project outcomes with stakeholder expectations
- enhancing financial management and budget control – including to enable tracking of earned value during implementation.
The importance of closure reports
Formal closure of a project is more than just the project finishing. Driving improved project performance over time requires careful consideration of how in-flight projects have performed, and how what we’ve learned should change the way projects are designed and delivered in future. Strengthened central oversight has this ‘system learning’ at its centre with the DTA ensuring lessons aren’t just identified but rather systematically learned across all major digital projects through real change which makes the difference.
Project closure reports play a vital role in this ‘system learning’ and, as closure reports have varied in quality, a closure reporting standard has been developed to ensure consistency and maximise the value of these reports.
Improving project closure reports
To formally close a project, agencies must provide a project closure report to all key stakeholders. However, some reports have included extensive information, requiring more resources than necessary, while others have provided insufficient information to accurately assess the project’s performance.
As a result, the DTA developed the Closure Reporting Standard for Digital and ICT-enabled projects. The standard provides a minimum and consistent set of information for reports based on 7 criteria – scope, schedule, budget, assurance, benefits realisation, transition arrangements, and lessons learned. By standardising closure reporting, the DTA is promoting best practice and providing the necessary information to evaluate completed projects and inform future investments.
We are drawing on expertise from across the APS and working with the Australian Taxation Office to develop templates to support implementation of the standard.
Image description and file download
PLACEHOLDER
Off